GIS for Python People
What is GIS?
Technically, Geographic Information Systems is
computer systems, infrastructure, software, an
entire industry dedicated to "spatial data"... blah, blah, blah,
blah
Really, GIS is mostly about "data used to make maps"
Spatial isn't Special
Spatial data is just regular data, with location info attached.
For Example...
Regular data:
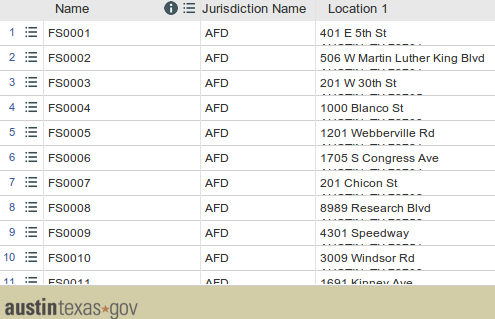
Table of firestations in Austin - via data.austintexas.gov
...Spatialized:
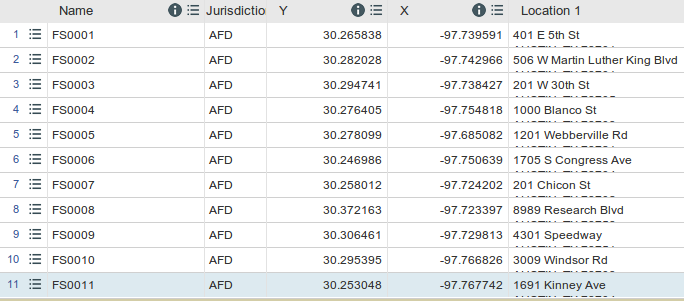
Table of firestations in Austin with lat/lon coordinates - via data.austintexas.gov
Which can make:
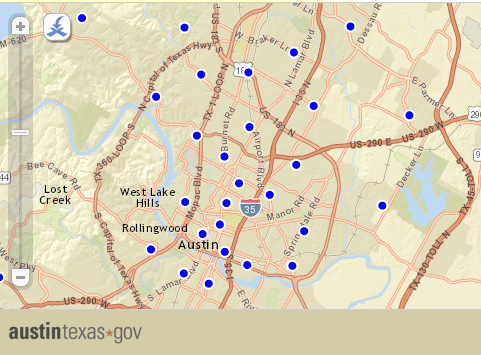
Map of firestations in Austin - via data.austintexas.gov
That's great...
so what?
Injecting spatial into your everyday data munging is an easy
way to punch up the impact of your products:
don't just show what, show where.
(Plus, maps just look cool.)
Types of GIS Data
Vector vs. Raster
Spatial data comes in two flavors: vector
and raster
Most likely, most of the data you'll work with (or create) will be vector data...
...But let's talk about rasters for a minute anyway.
Raster GIS data in
2 minutes or less
Rasters store data in pixel grids:
each pixel (or cell) stores
a single value.*
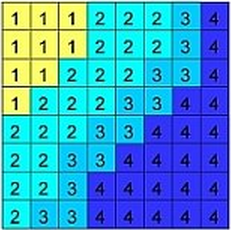
*Trivia: None is still a value.
Rasters can be useful for:
Aerial imagery

Elevation models
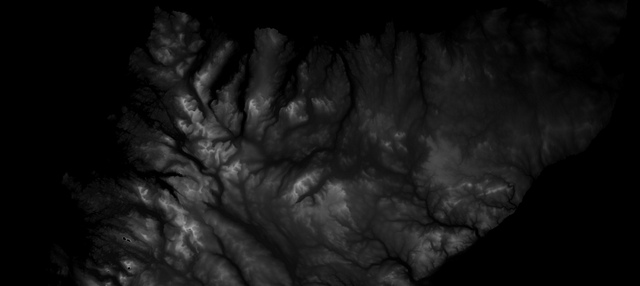
Remote sensing
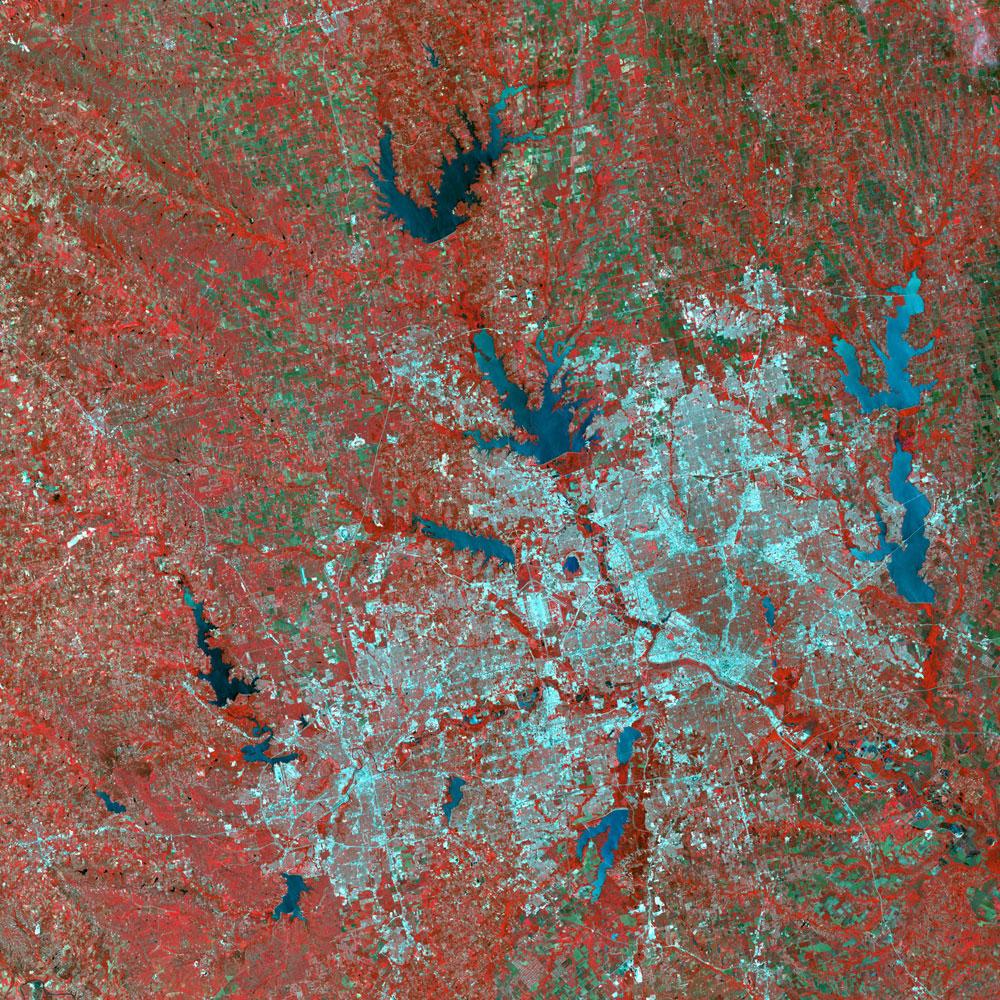
Raster GIS data is the same as "regular" digital images, just with location data attached.
What rasters are good for
Rasters are really good at representing information that uniformly covers a broad area (e.g., elevation).
Not so good for "discrete" entities (e.g., firestation locations, congressional districts).
For everything else, there's...
Vector GIS data
Points, lines, and polygons.
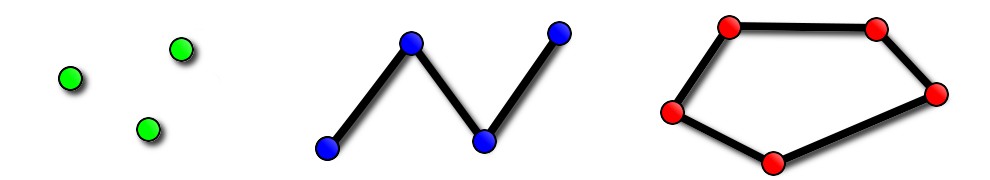
Not pixels.
Inherently spatial
Just like geometric points are defined by an (x,y) pair:
geospatial points can be defined by (lat/lon) coordinates.
What's it good for?
- Points of interest (e.g., firestations)
- Roads, rivers, boundary lines
- Lakes, building footprints, census areas
- etc.
Working With GIS Data
Step 0: look at the big picture
You've found some GIS data. Now what?
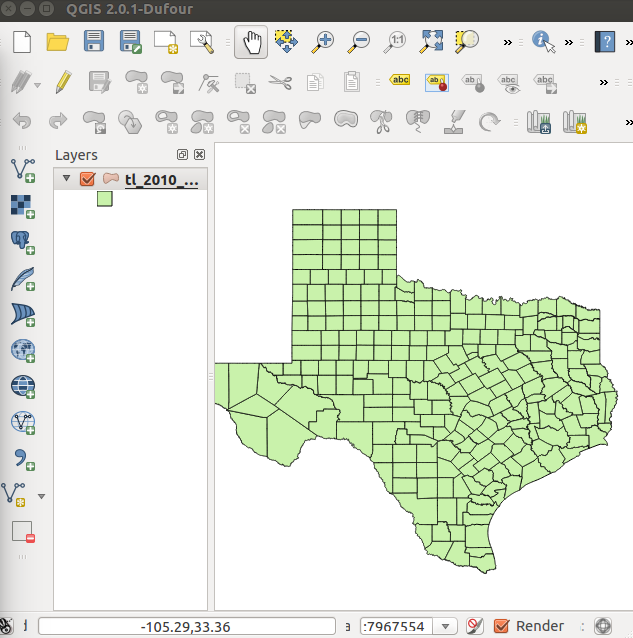
QGIS. Free & open-source - also offers a whole lot more than visual previews. Edit, query, analyze. Extend existing functionality via Python.
Storing data & GIS formats
Mostly, GIS data is stored like any other data, just with some added "spatial" components.
Options: Use a database, serialize your data, or download a shapefile and immediately convert it into something else.
Option 1: Use a database*
*Relational. Usually.
GIS data is traditionally stored in a spatial database.
That's just a regular database, plus extra spatial-enabled features:
- Geometry: store coordinates alongside attributes
- Spatial queries: i.e., "find all the pubs within 1 mile of me"
- Spatial indexing: spatial queries need optimization, too
(Use this)
PostGIS. The PostgreSQL you know & love, plus spatial goodness. Robust, reliable, well-supported.
Optional:
Spatialite. Spatially-enabled SQLite. Great for sharing data or development, probably not for production.
Option 2: Serialize All The Things
(Vector) GIS data can also be stored in a serialized format:
just add location data to existing formats.
(Use this)
GeoJSON. Regular JSON, but with coordinates. e.g.,
	{
	  "type": "Feature",
	  "geometry": {
 			"type": "Point",
 			"coordinates": [-97.740323, 30.274656]
	  },
	  "properties": {
		"name": "Texas Capitol Building",
		"address": "1100 Congress Ave, Austin, TX 78701"
	  }
	}
If you can tolerate XML:
KML. Google's XML flavor. Import into Google Earth.
But there's also...
Option 3: shapefiles
The most common format of GIS data right now:
most ready-made GIS vector
data from public data sources will be in shapefile format.
This is "a shapefile."
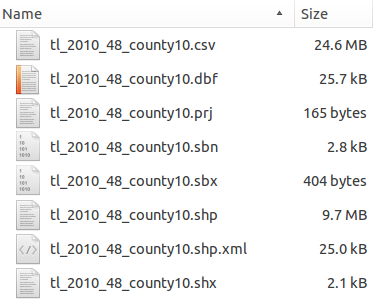
Yes, really.
Luckily...
With Python, reading a shapefile & writing it to a better format is easy.Playing with data
Reading & writing GIS data
Programmatic data munging
Suggestion: if you're stuck with shapefiles, start with pyshp.Pure Python, reads (and writes) shapefile data. That's all.
import shapefile

shp = shapefile.Reader(my_shapefile_path)
fields = shp.fields[1:]  # shp.fields[0] == deletion flag
field_names = [field[0] for field in fields]
records = shp.shapeRecords()
For more complicated things
GDAL/OGR: Massive library of raster & vector GIS tools.
Pros
- Free & open source
- Does everything... then cooks you dinner
Cons
- (Can be) a pain in the #%! to install/config
- Docs & features can be overwhelming
- Chaining commands gets cumbersome
- Native Python bindings are nasty
Good news: We speak Python
Caveat: Many Python libs still require GDAL/OGR installations and headers. Worth it, but can be a bumpy ride the first time around.
GIS I/O + Python
(Use THIS - not GDAL/OGR's vanilla APIs)
Fiona. Elegant Python API for OGR (vectors) - plus fio, a commandline tool
>>> with fiona.open('path/to/my_awesome_shapefile.shp', 'r') as collection:
>>>    print(len(collection))
>>>    # collections contain one object for each feature in input GIS data
>>>    print(collection[1])
>>>    # collections of features are iterable, GeoJSON-ready strings
$ fio info my_awesome_shapefile.shp
# json-ified data summary (e.g., feature count, bounding box coords, etc)
Supports every format OGR supports (not just shapefiles), makes reading/munging/writing GIS data a breeze.
For Rasters...
Rasterio. By Fiona's author: a GDAL-based library for raster I/O -- with bonus numpy interop.And yes, there's a command line tool rio.
The Fun Stuff
Shapely. After creating or extracting useful data, use this Python library for more complex manipulation & analysis.- Create buffers around vector elements
- Visualize things like convex hulls, unions, intersections, centroids...
- Find (geometric) differences between elements
Combine Fiona + Shapely to chain reading, converting, and analysing GIS data:
>>> with fiona.open('city_parks.shp', 'r') as collection:
>>>     parks = [shapely.geometry.shape(c['geometry']) for c in collection]

>>> park = parks[0] # grab the first park just for demo purposes

>>> park.type
'Polygon'

>>> park.area
20868.47980

>>> park.buffer(10.0).area
26877.85083

>>> (park.centroid.x, park.centroid.y)
(3100374.119480808, 10106879.690095564)
Useful ONLINE Tools
- geojson.io: Quickly validate & visualize your GeoJSON
- Mapshaper.org: Make giant datasets tiny, fast.
Geocoding services
- Geocode.io: Free+$; basic, clean & simple. US addresses only
- Mapquest API: Free+$$$; robust, less flashy. International
What to do with your spatial data?
Make maps.
Web mapping for fun & profit
Option 1: DIY Web Mapping Applications
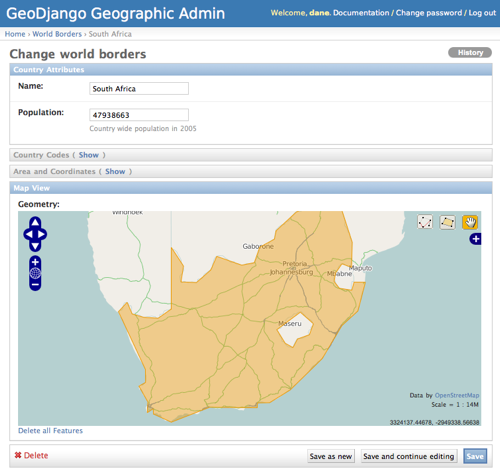
GeoDjango
Regular Django... but with maps.
- Include django.contrib.gis, stick PostGIS behind everything
- Create spatial models & use spatial-ized queries
- Your app is now magic
Option 2: Web Mapping for lazy busy developers
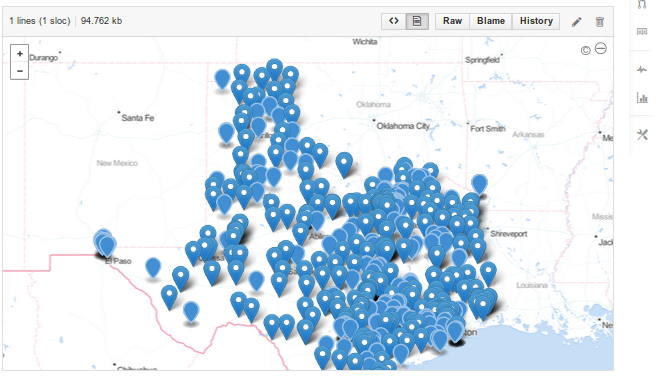
GitHub + GeoJSON
Maps in 2 minutes or less.
- Push a GeoJSON file to GitHub.
- View your GeoJSON file on GitHub.
- There is no step three.
TL;DR:
Spatial isn't all that specialPython makes things a lot easier
Maps are a great party trick